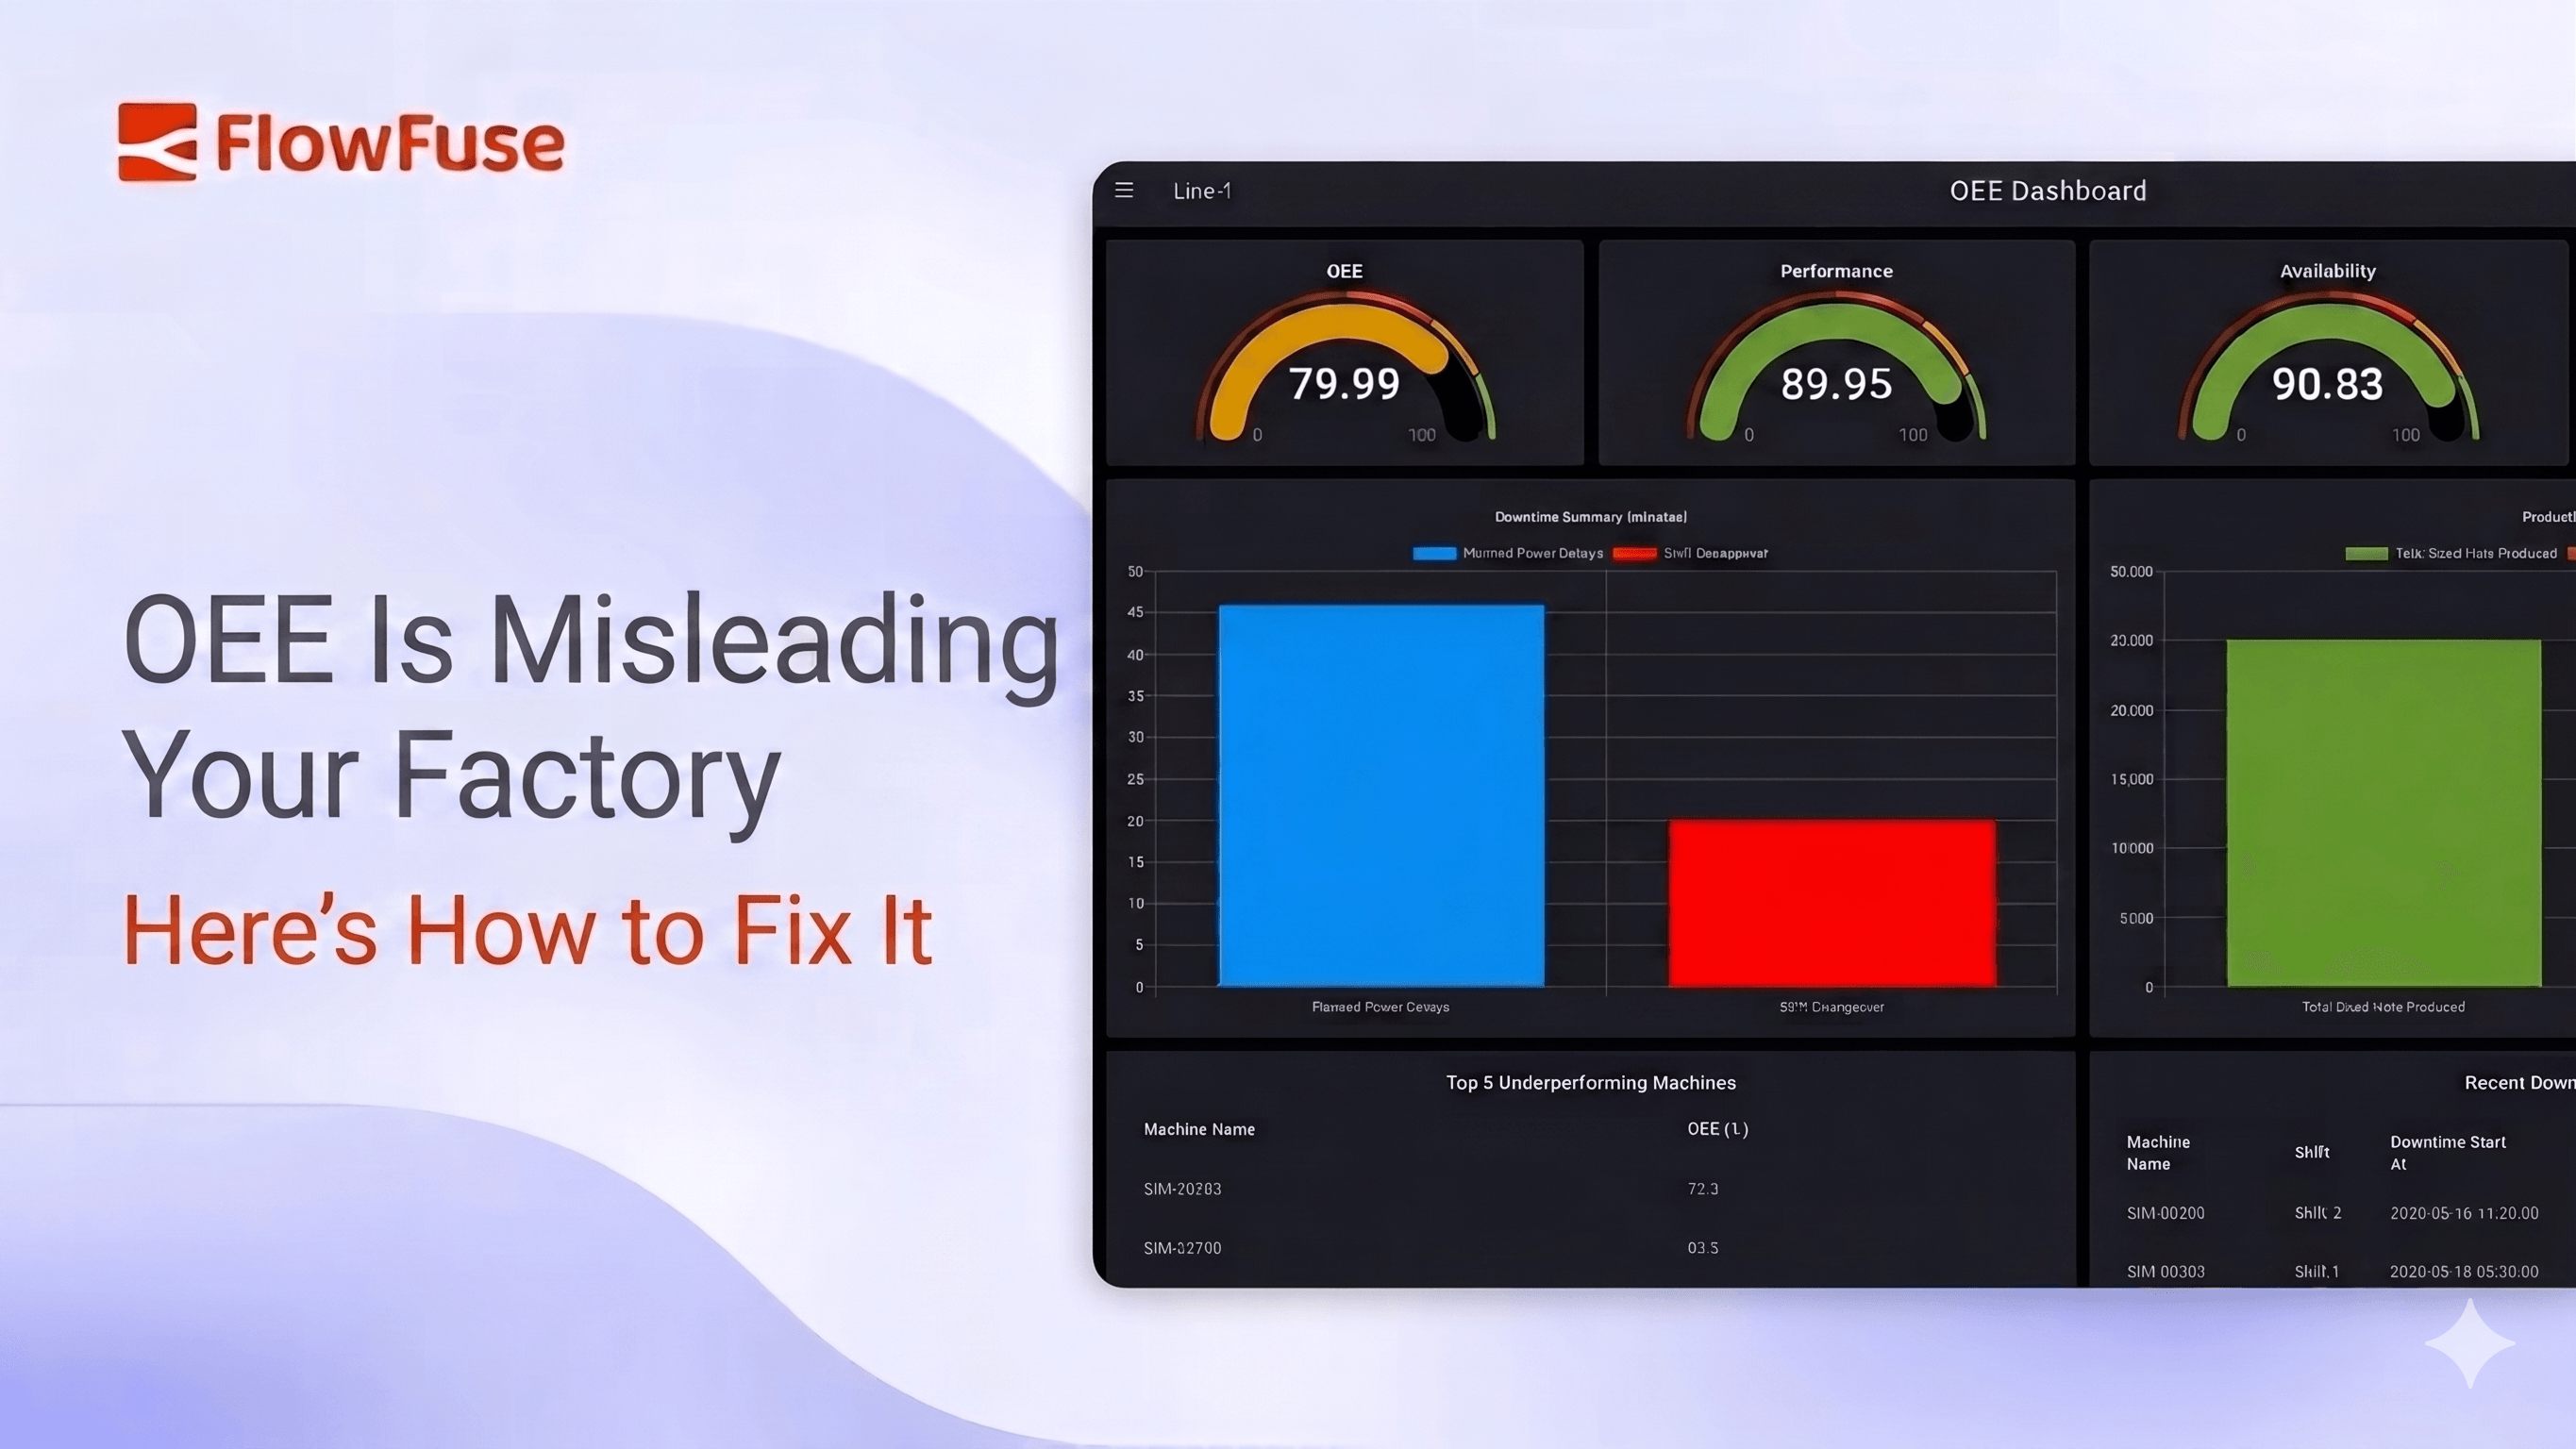
OEE Is Misleading Your Factory — Here's How to Fix It
Why the OEE score on your dashboard does not match what is happening on the floor.
"85% is called world-class OEE" gets repeated in every plant manager meeting. In reality, only 3-6% of manufacturers ever reach that level, and most operate much closer to 60%.
A pharma plant running at 72% under FDA validation rules is probably outperforming the automotive line bragging about 84%, but the quarterly review never frames it that way.
The formula is simple. Implementing it honestly almost never is. Definitions drift between sites. Manual collection misses small stops. Ideal cycle times get fudged. Operators game whatever gets measured. And the math itself fights you, push one component up and another usually drops.
This article looks at where OEE typically goes wrong on the shop floor, in how data is captured, how it is defined, and how it gets used, and what to fix so the number starts matching reality.
Most OEE numbers are made up
When operators log downtime on paper or fill in a spreadsheet at the end of the shift, manual systems typically capture only 60-70% of actual downtime. Micro-stops under five minutes get skipped almost entirely. Added up, these small losses often represent 10 to 15% of production time.
Operators rarely log events as they happen. They reconstruct the shift at the end, from memory, under time pressure. A 90-second jam that happened four hours ago becomes "a couple of minutes," gets folded into the next stop, or never gets logged.
Speed losses are worse. A line running at 85% of rated speed all shift logs zero downtime events but loses 15% of its output. Without a recorded actual rate, Performance defaults to 100% and the loss disappears.
Put it together and manual OEE is often overestimated by 10-25%. The dashboard says 78%. The real number is closer to 60%. Decisions get made on the 78%.
The fix is structural. PLCs already know when a line stopped, how long it ran below rated speed, and how many parts came off. Connecting FlowFuse to the PLC over OPC-UA, Modbus, S7, or EtherNet/IP pulls that data straight off the machine. The operator's job changes from logging the stop to classifying the cause. FlowFuse's OEE Dashboard blueprint gives you the calculation and visualisation layer on top of that.
Everyone calculates OEE differently
Two plants in the same company report 75% OEE. It looks comparable, but it usually is not.
One plant counts changeovers as planned downtime. The other counts them as unplanned. One uses the machine's rated speed as the ideal cycle time. The other uses whatever speed they managed last quarter. Same formula. Different inputs. Same number on the slide, different reality on the floor.
Even in corporations using standardized MES systems, OEE figures are not automatically comparable. Small differences in how setup time, breaks, planned maintenance, or first-pass quality get classified can significantly change the final score.
The biggest distortion usually comes from ideal cycle time. It is supposed to be the machine's rated speed. In practice, plants set it too low to account for aging machinery or material issues. The score improves, but the loss does not disappear, it just gets built into the baseline.
Quality has a similar issue. OEE is meant to count only first-pass good parts. Including reworked parts hides the fact that opportunity exists for improving first-pass process quality. The line still ships the part, but the rework effort keeps growing.
Then there is the "Other" category. Once that bucket grows past 10-15% of logged downtime events, the dataset cannot identify top failure modes or drive maintenance decisions. You know the line stopped, but not why.
The fix here is not more tools, it is consistency. Define what counts as planned downtime. Fix the cycle time for each product. Agree on what qualifies as first-pass quality. Use structured reason codes instead of free text.
Without that, OEE comparisons across plants are not comparing performance. They are comparing definitions.
People game whatever you measure
Put a target on a metric and attach it to performance reviews, and the metric stops measuring reality. It starts measuring how well people produce the number.
Stops under a certain length stop getting logged. Changeovers get coded as planned instead of unplanned. Difficult products get pushed to the next shift. Maintenance gets scheduled during "non-production" windows so it does not count. The number improves. The process does not.
The deeper damage is trust. Operators stop believing the dashboard because it does not reflect what actually happened. Managers stop trusting operators because the numbers look manipulated. Maintenance stops trusting downtime data because they know which codes get used to make availability look better.
There is also slower drift at the management level. Ideal cycle times get adjusted downward. Planned downtime definitions get widened. Scheduled production time gets narrowed. Each change is small and defensible. Over time, the score loses meaning.
The fix is removing the incentive to game. Use OEE as a diagnostic, not a scorecard. Stop ranking shifts on it. Stop tying it to bonuses. Make the goal "find the losses," not "hit 80%."
The benchmark trap
The 85% number gets repeated like a rule. It came from Seiichi Nakajima's TPM framework in the 1980s, based on 90% availability, 95% performance, and 99.9% quality. It was a directional target for stable, high-volume manufacturing, not a universal benchmark.
Apply it without context and it breaks. Highly regulated industries see OEE 20-40% lower than less regulated ones, and that gap is not always waste.
The bigger problem is focus. A plant at 45% does not need a roadmap to 85%. It needs to fix the biggest losses, which might move it to 55% in a quarter. The real benchmark is continuous improvement over your own baseline, not someone else's industry average.
Plant-level averages hide everything. Averaging OEE across an entire facility produces a meaningless number. You can't improve "the plant", you improve specific machines, lines, and processes. A bottleneck at 58% matters more than multiple machines at 88%.
Tracking without acting
A lot of plants have gone through the full OEE journey. Bought the software. Installed the dashboards. Trained the operators. Put the screens on the floor. Six months later the same three reasons still top the Pareto chart.
Material wait. Changeover. Minor stops. No change.
From a distance, the system looks active. On the floor, it feels like a report nobody uses.
The issue is ownership. Production logs downtime, but maintenance, engineering, or procurement must fix it. The insight sits in one team, the action in another, and nothing closes the loop.
This is also where OEE's structural limits show up. A high OEE on a non-bottleneck machine is not a good thing—if a machine that is not the bottleneck runs at high OEE, it leads to a jam of parts before the bottleneck. The machine looks efficient. The system does not improve. Focus OEE tracking on the bottleneck and the lines feeding it.
The fix is to connect data to action. A recurring failure should trigger a maintenance work order. A material delay should alert procurement and the line lead. A changeover overrun should create a kaizen task.
FlowFuse sits in that gap, taking a downtime event from the line and turning it into a maintenance ticket, a procurement alert, or an escalation in real time. The metric only matters if it leads to something changing on the floor.
What to actually do
-
Get the data from the machines, not the operators. The PLC already knows when the line stopped, how fast it ran, and how many parts came off. The operator classifies the cause. Everything else falls apart without this. This is the layer FlowFuse handles, pulling the data straight off the PLC over OPC-UA, Modbus, S7, or EtherNet/IP.
-
Write down your definitions. Make every site calculate the same way before comparing any numbers. Use a hierarchical reason code tree, not free text. Kill the "Other" bucket.
-
Apply OEE where it maps to throughput. The bottleneck and the lines feeding it. High OEE on a non-bottleneck machine is WIP piling up before the constraint.
-
Stop ranking shifts on the score. The moment OEE becomes a stick, the data becomes fiction.
-
Pair OEE with metrics that catch what it misses. Throughput. First-pass yield. On-time-in-full. MTBF. The single number is a summary, not the picture.
-
Wire the data into action. A logged event that does not trigger a ticket, an alert, or a kaizen item is a row in a database, not a fix. This is where FlowFuse earns its place, turning a downtime event into a maintenance ticket, a procurement alert, or a kaizen task in real time.
-
Compare against your own baseline. Not the industry. Not 85%. Last month, last shift, last product run.
Closing
OEE is not broken. It is just often misunderstood.
Used as a target, it gets gamed. Used as a comparison, it misleads. But used as a diagnostic, grounded in real data and consistent definitions, it becomes one of the most useful tools on the shop floor.
The difference is not in the formula. It is in how honestly you measure and whether anything changes because of it.
The value of OEE is not the number you report. It is the problems you uncover and the actions you take next.
Get help connecting your machines
Tell us what PLCs and protocols you are working with. We will show you how FlowFuse pulls the data and what an honest OEE dashboard looks like on your line.
About the Author
Sumit Shinde
Technical Writer
Sumit is a Technical Writer at FlowFuse who helps engineers adopt Node-RED for industrial automation projects. He has authored over 100 articles covering industrial protocols (OPC UA, MQTT, Modbus), Unified Namespace architectures, and practical manufacturing solutions. Through his writing, he makes complex industrial concepts accessible, helping teams connect legacy equipment, build real-time dashboards, and implement Industry 4.0 strategies.
Related Articles:
- FlowFuse 2.30: Expert Builds Your Industrial Application
- The Rosetta Stone for Factories: Why IIoT Needs a Common Language First
- Diagnosing Modbus Degradation: From CRC Errors to TCP Timeouts
- Cloud, Edge, or Both? How to Choose Your Deployment Before an Outage Does It For You
- How to Stop Noisy Sensor Data from Flooding Your Industrial System